FT Partners Quarterly FinTech Insights and Annual Almanac
FT Partners is the only data source for comprehensive, global FinTech deal activity covering M&A, Financing and IPO statistics and trends
FT Partners’ FinTech Insights Reports are published on a quarterly basis, along with a comprehensive year-end Almanac. All information included in the reports is sourced from FT Partners’ Proprietary Transaction Database, which is compiled by the FT Partners Strategic Insights Team through primary research and data analysis. The reports feature M&A, financing and IPO statistics and trends as well as breakdowns by FinTech vertical, geography, investor-type and much more.
Also view our quarterly InsurTech Insights reports here.
Be sure to check back for quarterly updates and additions. All recent reports can be viewed or downloaded for free below.
2025 FinTech Almanac
Report Features:
- 2025 and historical FinTech financing, IPO and M&A volume and deal count statistics
- Largest FinTech financings and M&A transactions in 2025
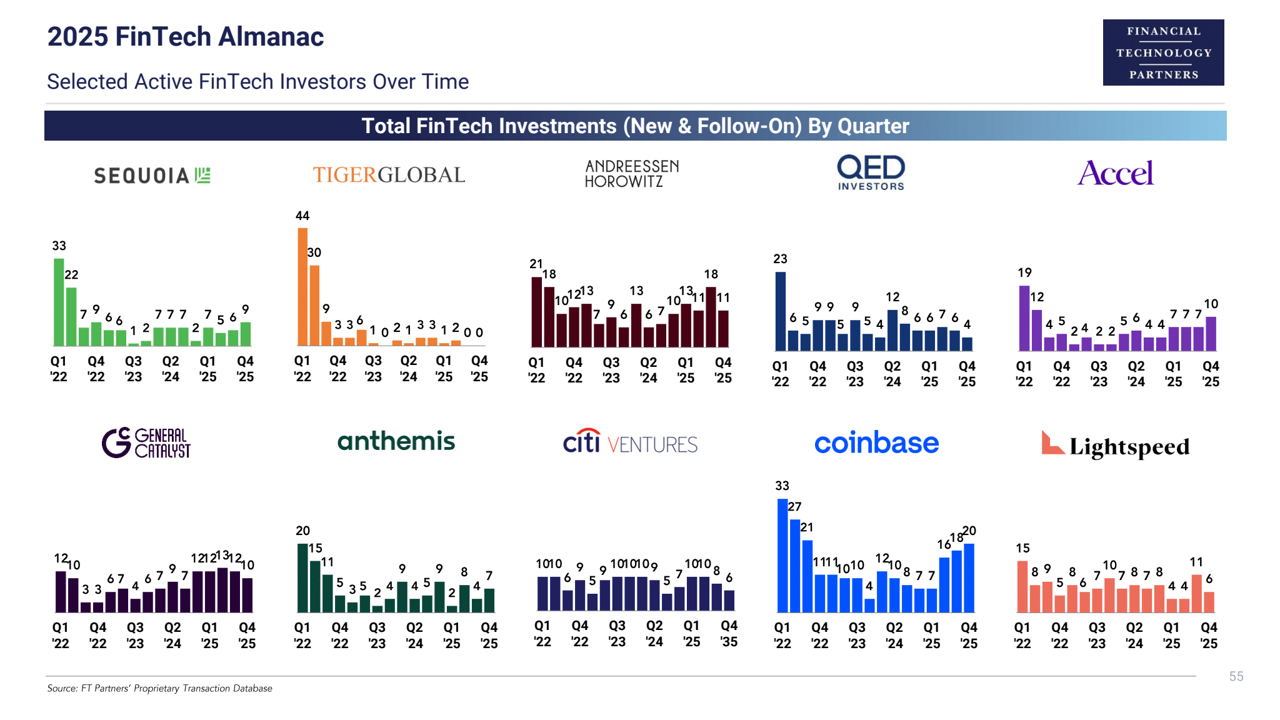
- Most active FinTech investors including strategic investor participation
- Breakdowns by geography and deal type
- FinTech sector and sub-sector highlights
Key Highlights:
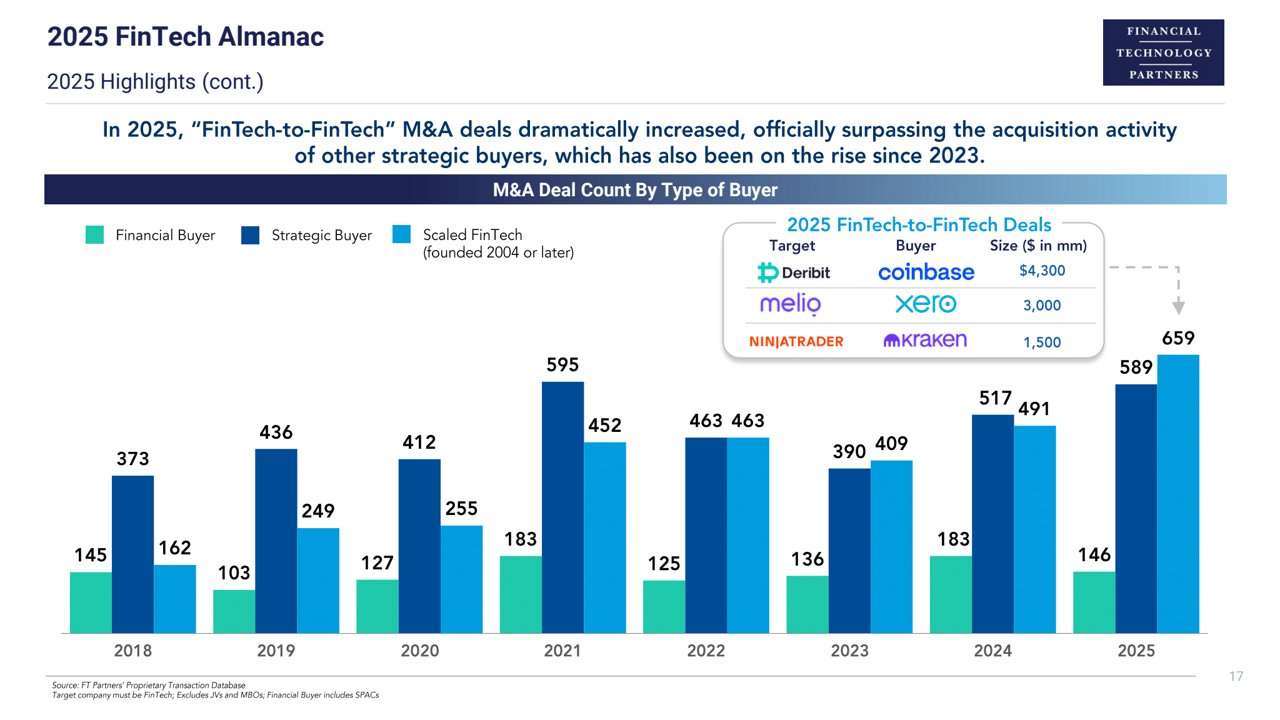
- For the first time ever, scaled FinTech companies (those founded 2004 or later) made more FinTech acquisitions than other strategics (banks / FIs, legacy tech / FinTech players, etc.).
- The number of $1 billion+ M&A deals during the year (59) rivalled the record number reached in 2021 (62) and represented an increase of 40% over last year's count.
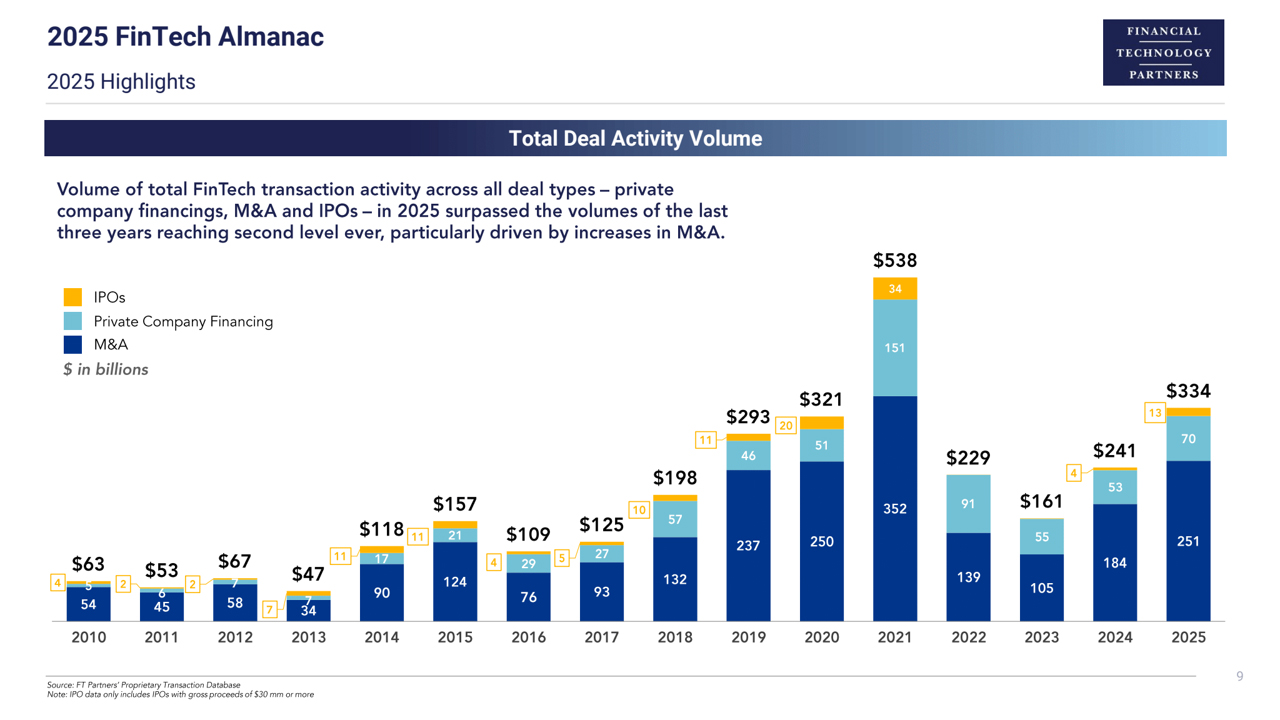
- Private company funding volume across all stages grew moderately in 2025, rising above the prior two years to reach more than $70 billion in total.
- Conversely, the number of capital raises declined year-over-year as investors shifted to later-stage / large-scale plays, consolidating capital around a fewer number of companies.
- Funding volumes in the Wealth & Capital Markets Tech, Crypto & Blockchain, and InsurTech sectors all recorded 50%+ YoY growth.
View Prior Reports


