FT Partners & Blue Dot Investors: The Coming FinTech Liquidity Supercycle

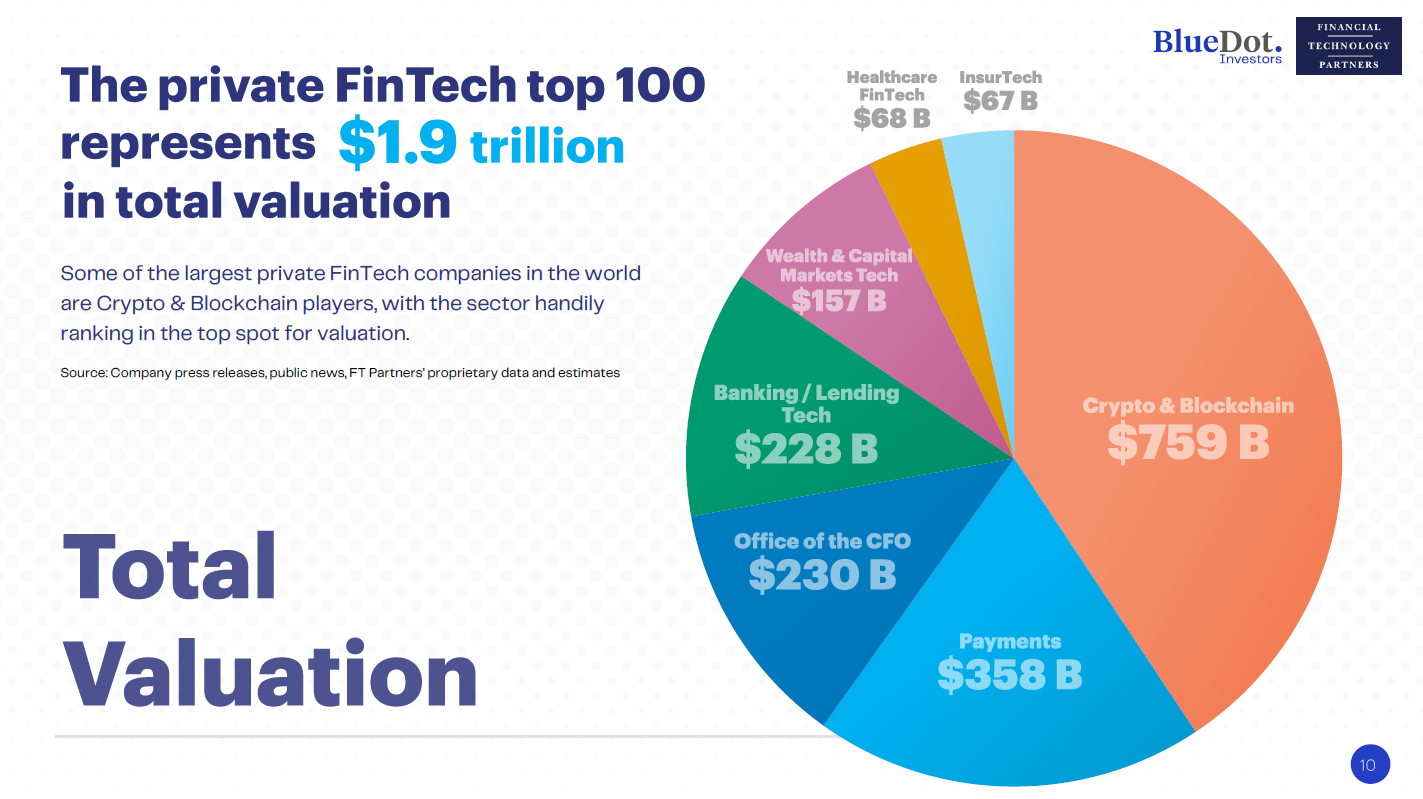
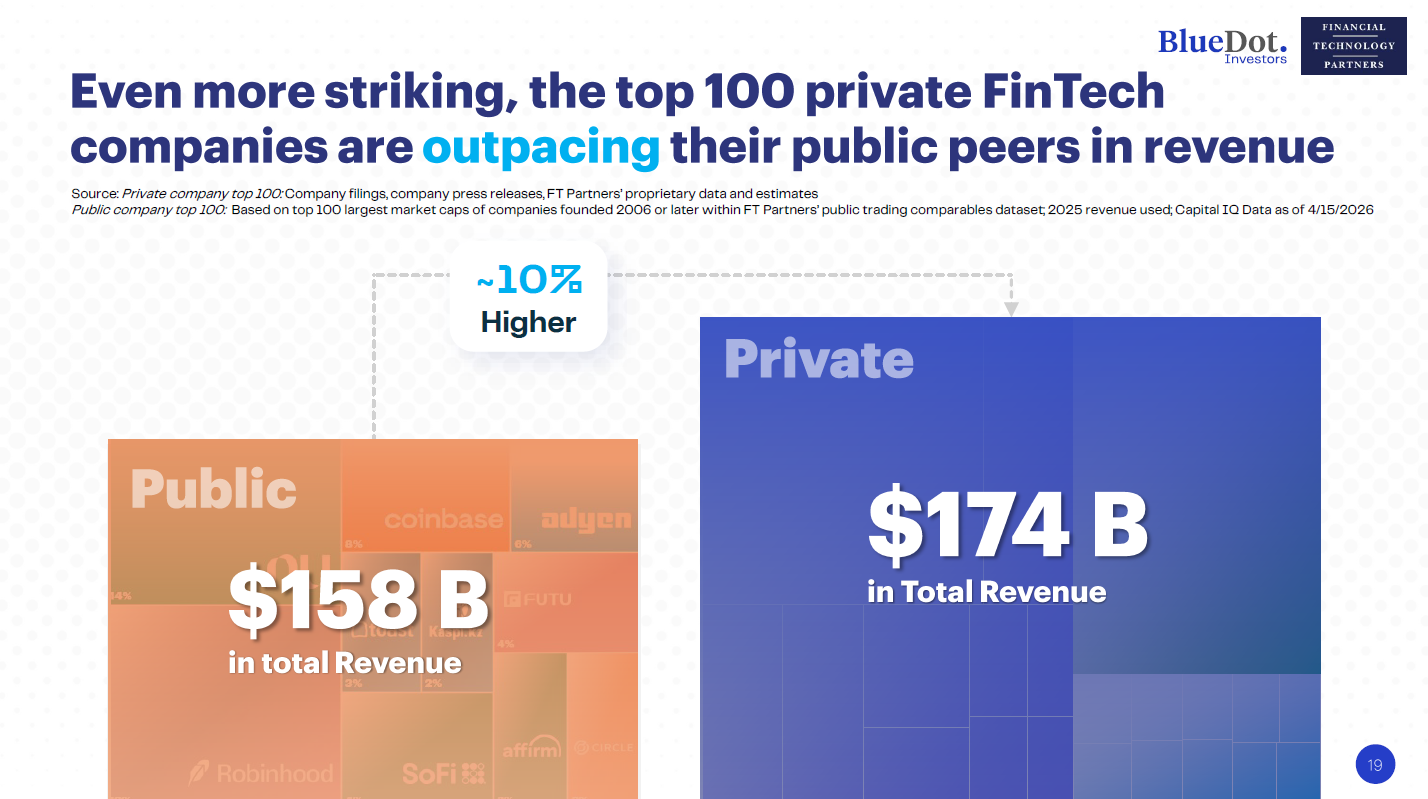
Executive summary: For this joint report with Blue Dot Investors we curated a definitive list of the top 100 largest private FinTech companies by valuation based on public benchmarks and proprietary estimations. The big reveal? The top 100 private FinTech companies in the world now generate more revenue than the 100 largest public FinTech companies founded in the last twenty years. Valued at $1.9 trillion in total, the private 100’s valuation is nearly 3x larger than the total market cap of its public peers. This trillion-dollar private cohort, in addition to several hundred more unicorns and thousands of up-and-coming startups, is nonetheless primed for increased capital markets activity – be it ongoing consolidation through an expanding buyer universe, a massive secondary market for later-stage companies, or a re-opening of the IPO window.
Key Market Statistics & Findings
Revenue Leadership: Revenue of the top 100 private FinTech companies ($174 billion) now exceeds that of the top 100 public companies founded in the last twenty years ($158 billion).
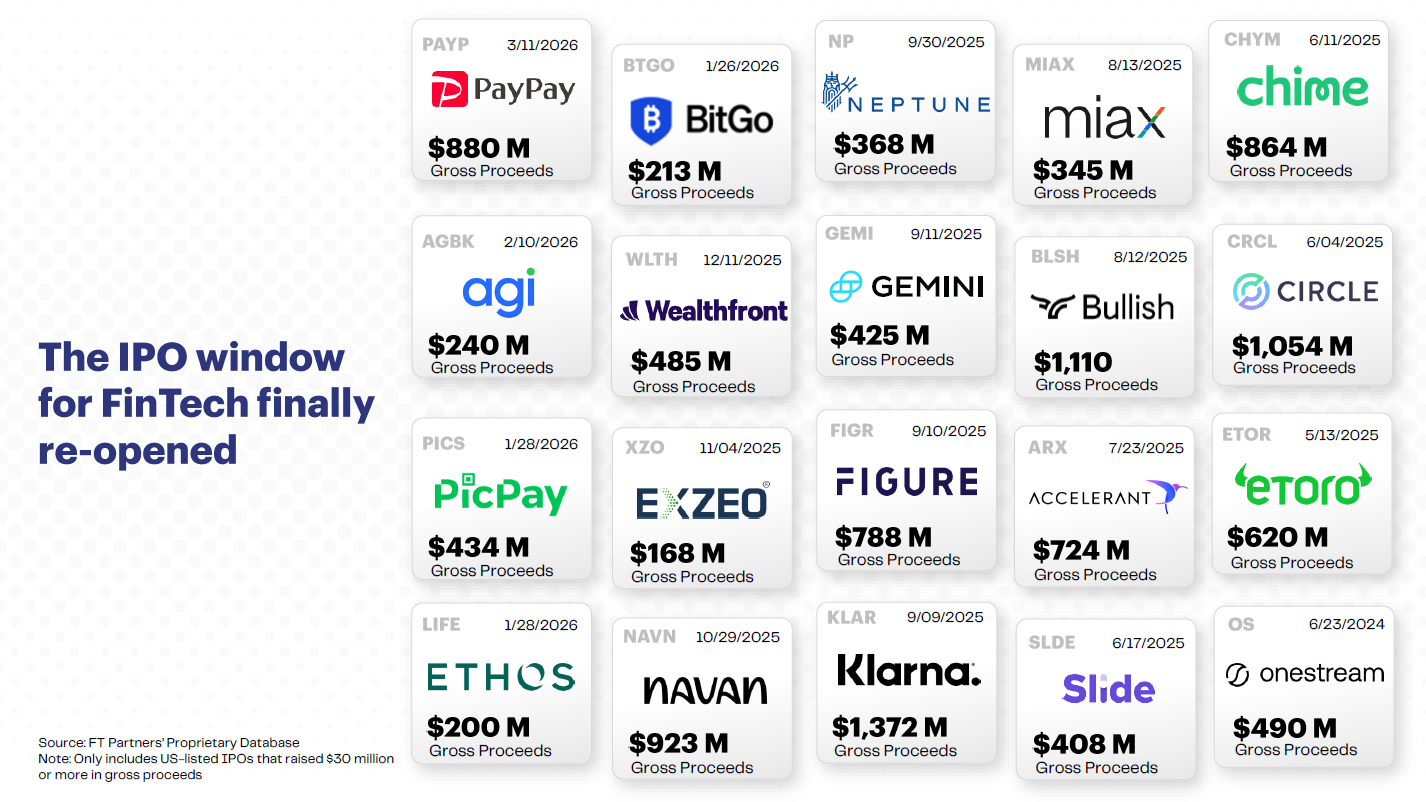
The Reopening IPO Window: 26 FinTech companies have listed in the U.S. since 2024, showing a 3.4x increase in median revenue at IPO ($673 million) compared to the 2011-2019 cycle.
Profitability Trends: 69% of FinTech companies going public today are profitable, up from 52% in the 2011-2019 cohort.
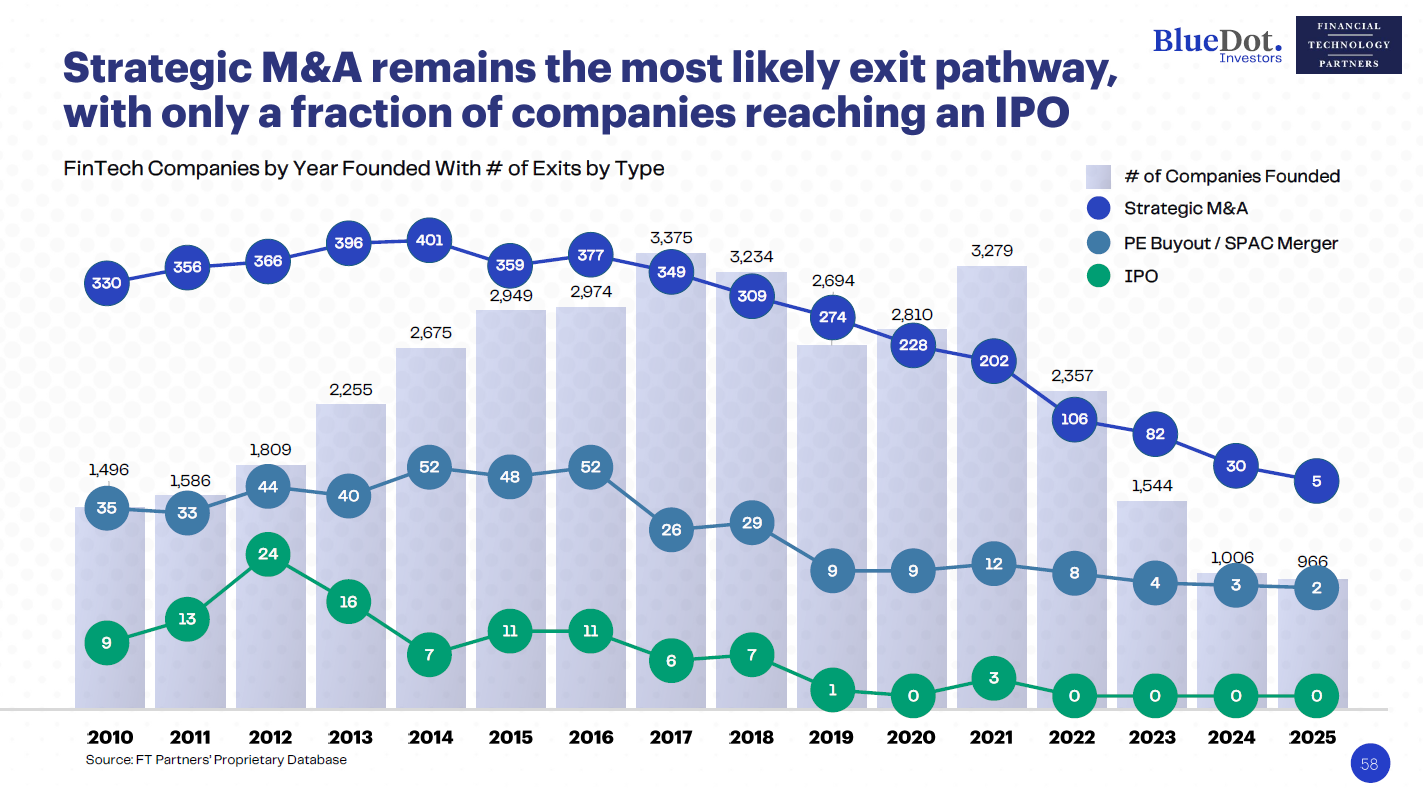
Consolidation via M&A: FinTech-to-FinTech acquisition activity has increased 4.4x over the last decade as scaled players use their balance sheets to acquire specialized competitors.
Focused Secondary Volume: Secondary market liquidity remains highly concentrated – according to Caplight Research – with nearly 96% of volume occurring in the top 10 companies, creating a “long-tail opportunity” for investors to acquire high-quality, underrepresented assets outside the most heavily traded names
Ecosystem Scale: More than 55,000 FinTech companies have been founded globally over the last 20+ years.
Featured Pages